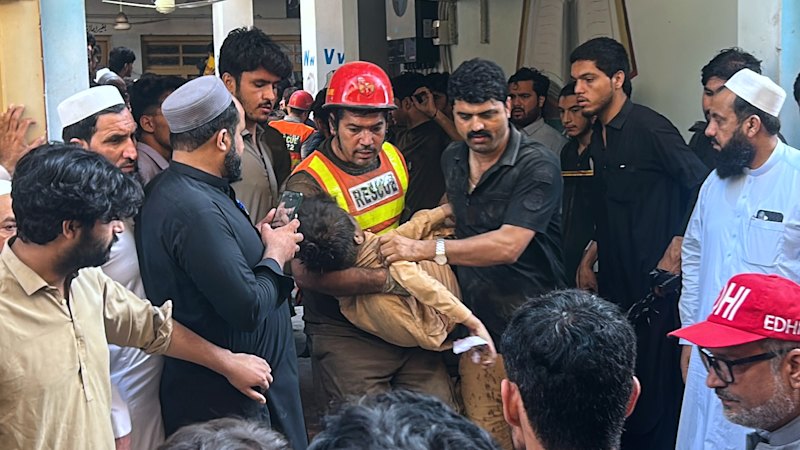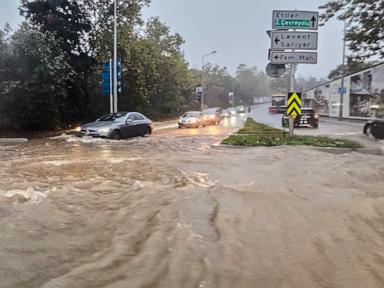
Extreme rainfall does not create urban disasters by itself; impervious surfaces, encroached floodplains, and undersized drainage networks convert meteorological extremes into fatalities and economic paralysis. Standard headline reporting on Istanbul's October 2026 deluges—which brought the heaviest rainfall in over 80 years and triggered widespread shutdowns and initial reports of three deaths—treats the event as a sudden external shock. A rigorous systems view treats the storm as a stress test on a megacity of roughly 16 million people whose hydrological baseline has been systematically altered.
Deconstructing the Standard Headline Narrative
Conventional news coverage of severe weather follows a predictable cause-and-effect chain: heavy rain falls, drainage is overwhelmed, streets flood, transport halts, and lives are lost. That sequence is accurate at a surface level, yet it obscures the structural variables that determine whether a downpour becomes a localized inconvenience or a multi-district emergency.
A critical distinction separates known facts from educated hypotheses in rapid-response reporting:
- Known facts: Intense rainfall struck Istanbul in mid-October 2026 (reaching 277.1 kg/m² in Beykoz, the highest reading since 1942), prompting emergency responses to over a thousand flooding and landslide incidents, disrupting transport, and causing initial fatalities that later climbed as search operations expanded.
- Educated hypotheses: Attribution studies and hydrological assessments indicate that warmer atmospheric conditions intensify extreme precipitation events, while decades of urban expansion across valleys and stream corridors amplified runoff velocity and surface accumulation. Exact micro-level attribution for every street or culvert requires post-event hydraulic modeling that is rarely available during active rescue operations.
When coverage stops at "heavy rain caused flooding," it conflates a trigger (precipitation intensity and duration) with vulnerability (land cover, channel capacity, and emergency response exposure). Two districts can experience similar rainfall totals while producing vastly different damage profiles depending on topography, soil sealing, and drainage geometry.
The Three Pillars of Urban Flood Vulnerability
To analyze why a megacity shuts down under extreme rain, evaluate the system across three interacting pillars: Hydrological Exposure, Imperviousness and Channel Compression, and Network Fragility.
Hydrological Exposure
Hydrological exposure measures the volume and intensity of water arriving at a watershed relative to historical design assumptions. Drainage systems across mature cities are engineered around historical return periods—such as 10-, 25-, or 100-year storm profiles—derived from past meteorological records. When a storm exceeds eight-decade benchmarks in localized pockets, runoff volume outpaces pipe and channel conveyance almost by definition. Steep gradients and concentrated convective cells shorten the time of concentration—the time it takes for rain falling at the farthest edge of a catchment to reach a discharge point—producing sharp flash-flood peaks rather than gradual rises.
Imperviousness and Channel Compression
Natural landscapes buffer rainfall through canopy interception, soil infiltration, and floodplain storage. Replacing vegetation and permeable soil with asphalt, concrete rooftops, and compacted fill—a process known as soil sealing—shifts the water balance toward rapid surface runoff.
In Istanbul, rapid post-1950 and post-1980 urbanization pushed residential, commercial, and transport corridors into valley floors and along creek basins such as Alibey, Kağıthane, Ayazağa, and Cendere, while older waterways in central districts were culverted or built over. Constraining a stream channel or narrowing a floodplain reduces cross-sectional flow area and storage volume. Under the continuity principle of fluid mechanics, when volumetric flow rate rises sharply inside a narrowed or obstructed conduit, flow depth and velocity increase—turning roads and underpasses into high-energy conveyance channels.
Network Fragility
A city "shuts down" not merely because water covers pavement, but because interconnected infrastructure networks fail in sequence. Surface flooding immobilizes commuter buses and private vehicles, while debris carried by fast-moving water clogs grates, bridges, and culverts. Where stormwater and wastewater share combined conduits, surcharge during heavy rain creates health and contamination hazards as diluted sewage backs up. Low-lying basements, ground-floor commercial spaces, and electrical installations face acute hazard when water levels rise rapidly or when power infrastructure intersects with floodwater.
Missed Cause-and-Effect Chains Behind City Shutdowns
Surface reporting often treats transport gridlock, structural damage, and casualties as parallel outcomes of the rain. In operational reality, they form causal chains with compounding feedback loops:
- Debris entrainment constricts capacity: Heavy runoff erodes loose soil and sweeps street litter, construction material, and branches downstream. When that load accumulates at bridge piers, culverts, or inlet grates, effective drainage capacity drops mid-storm, causing localized ponding even where upstream pipes were sized for moderate flow.
- Commuter bottlenecks trap people in transit: When arterial roads flood simultaneously, vehicles stall and queue, converting moving traffic into stationary obstacles. Passengers stranded inside vehicles or low-lying transit points face heightened danger as water depths climb faster than evacuation routes clear.
- Basement and ground-floor accumulation magnifies losses: Topographic depressions and former stream beds act as collection basins. Water flowing off paved slopes concentrates in low points, flooding ground-level shops, inventory, and mechanical rooms—a mechanism reflected in surging insurance claims and commercial losses after major events.
- Post-event tallying lags initial reports: Early casualty and damage figures during active flooding are provisional snapshots. Floodwaters sweep victims across municipal boundaries, obscure submerged vehicles and structures, and delay access to isolated pockets, which is why verified death tolls and financial damage estimates frequently rise over subsequent days.
The Cost Function of Flood Events
From an economic and operational standpoint, total flood cost ($C_{\text{total}}$) is not a fixed number tied solely to millimeters of rain; it behaves as a function of hazard intensity, exposure, and system fragility:
$$C_{\text{total}} = f(H, E, V, R)$$
- $H$ (Hazard severity): Rainfall intensity, duration, spatial concentration, and antecedent soil moisture.
- $E$ (Exposure): Population density, commercial assets, vehicles, and critical infrastructure situated within floodplains and low-lying corridors.
- $V$ (Vulnerability): Degree of soil sealing, channel encroachment, culvert maintenance state, and building/infrastructure design standards.
- $R$ (Response and recovery friction): Speed of early warnings, road closures, emergency dispatch, and utility isolation.
A practitioner managing municipal resilience looks at the partial derivatives of this function. Reducing $H$ directly is outside local control during an active storm, though national and global climate mitigation shapes long-term extremity trends. Altering $E$, $V$, and $R$, however, sits squarely within urban governance, engineering standards, and operational execution.
Tactical Playbook for Flood Risk Reduction
Moving from reactive disaster response to measurable risk reduction requires sequenced interventions across planning, engineering, and operations.
1. Enforce Floodplain and Watershed Boundaries
- Audit active and proposed zoning plans against updated hydrological and floodplain maps across every major creek basin.
- Halt new high-density or critical construction in high-risk flood zones and establish non-negotiable riparian setback buffers.
- Prioritize acquiring or repurposing high-frequency flood-prone parcels into retention parks, permeable green corridors, or sports fields that can safely store excess water during peak storms.
2. Upgrade Conveyance, Retention, and Separation
- Map choke points—culverts, underpasses, bridges, and combined sewer overflows—using hydraulic models updated for higher-intensity rainfall scenarios.
- Pair grey infrastructure upgrades (larger relief culverts, pump stations, and sewer separation where feasible) with distributed green infrastructure (bioswales, permeable pavements, and upstream detention basins) to slow peak runoff before it hits dense neighborhoods.
- Institute pre-storm and continuous clearing protocols for inlet grates, stream screens, and bridge openings so debris does not choke flow paths during peak downpours.
3. Harden Operations and Early-Action Triggers
- Tie meteorological radar and gauge thresholds directly to automated traffic advisories, underpass closures, and emergency crew pre-positioning before roads become impassable.
- Establish clear protocols for isolating electrical hazards in flooded zones and protecting critical municipal facilities.
- Standardize post-event forensic reviews—tracking exact inundation depths, culvert blockages, and response bottlenecks—so every storm updates capital priorities rather than repeating past vulnerabilities.
Limitations and Operational Trade-Offs
No engineering or policy framework eliminates flood risk completely. Retrofitting a dense megacity faces hard physical, financial, and political constraints:
- Space and land-use friction: Widening channels or restoring natural floodplains in built-up districts requires land acquisition, displacement, or demolition of existing structures, all of which carry high economic and social costs.
- Capital vs. return-period limits: Sizing every pipe and channel for rare, extreme rainfall events demands massive upfront capital and maintenance budgets that must compete with other essential priorities such as seismic retrofitting, transit, and water supply.
- Incomplete data and attribution lag: High-resolution drainage maps are sometimes outdated or incomplete in rapidly transformed neighborhoods, and distinguishing natural variability from long-term climate trends in a single storm takes rigorous post-event analysis.
Strategic Recommendation
Municipal leaders and infrastructure operators should treat extreme precipitation as a recurring design parameter rather than an eighty-year anomaly, and immediately audit every creek corridor and arterial underpass for choke points, runoff bottlenecks, and evacuation traps ahead of the next wet season. Funding should be prioritized first toward clearing and expanding critical bottlenecks, locking down floodplain zoning, and deploying real-time hydrological triggers that close vulnerable corridors before gridlock sets in—delivering rapid risk reduction at a fraction of the cost of rebuilding after inundation.